$XRP detailed analysis (long post, read along)
Yesterday we saw XRP hit an ATH in USD terms, but there are a few other charts we have been tracking over the last year that haven't really signaled full bull just yet
I think of all these pairings as launch checklists, the more that check the box, the stronger the trend can be
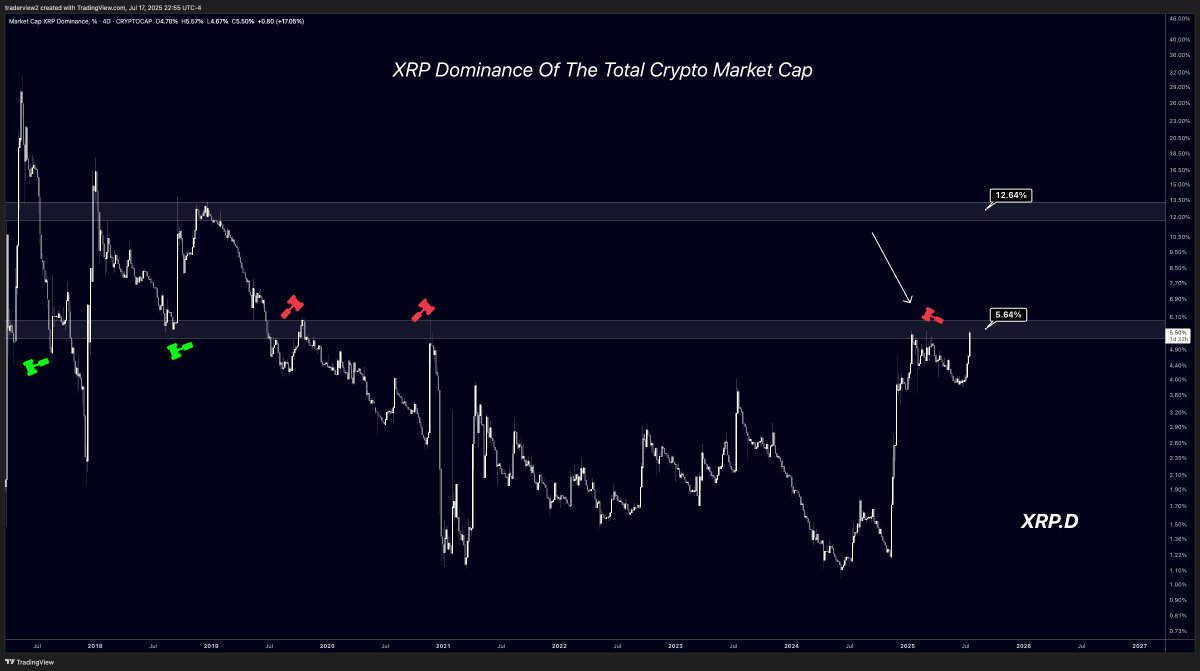
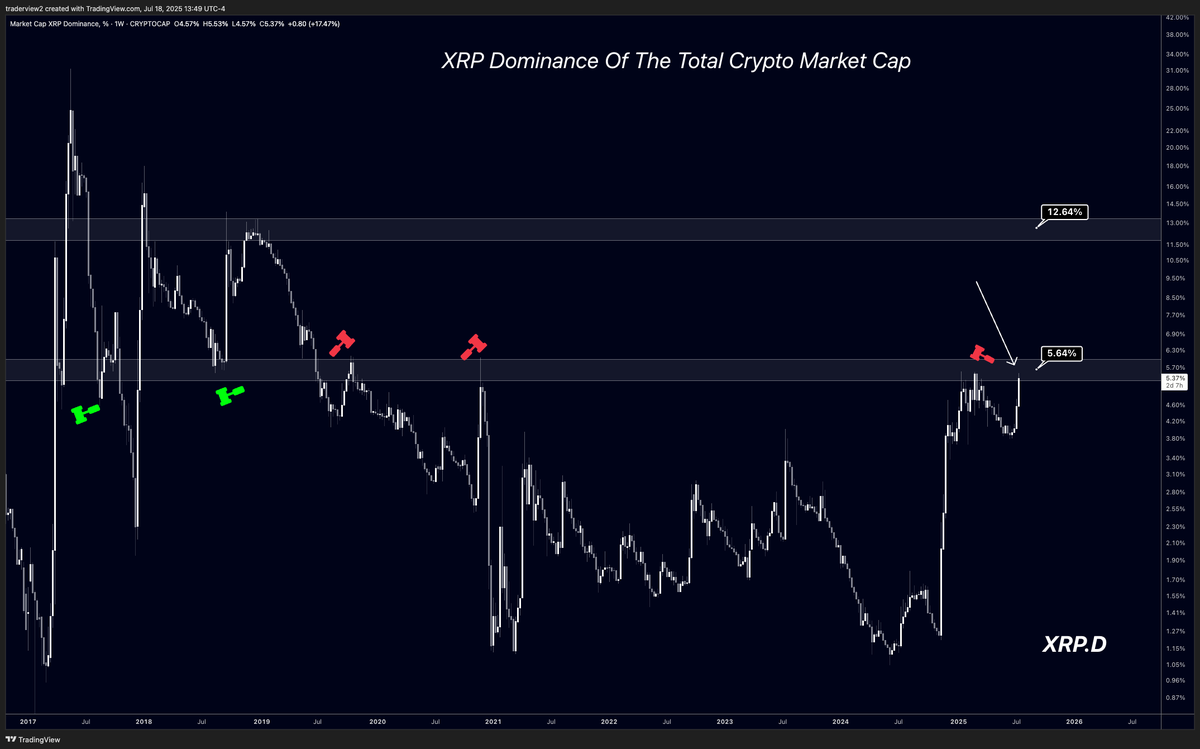
First one - $XRP.D:
I tracked this chart a lot earlier this year when XRP first hit $3 and here we are back to the resistance level that has held it down for over 2200 days.
Despite $XRP/USD signaling a full break of structure, the dominance chart has yet to do so.
Anytime $XRP.D broke the current resistance in the past, we saw a 2x shortly after. If history repeated after a successful break, this would land us near a target of $7-$10 depending on how much the rest of the market moves
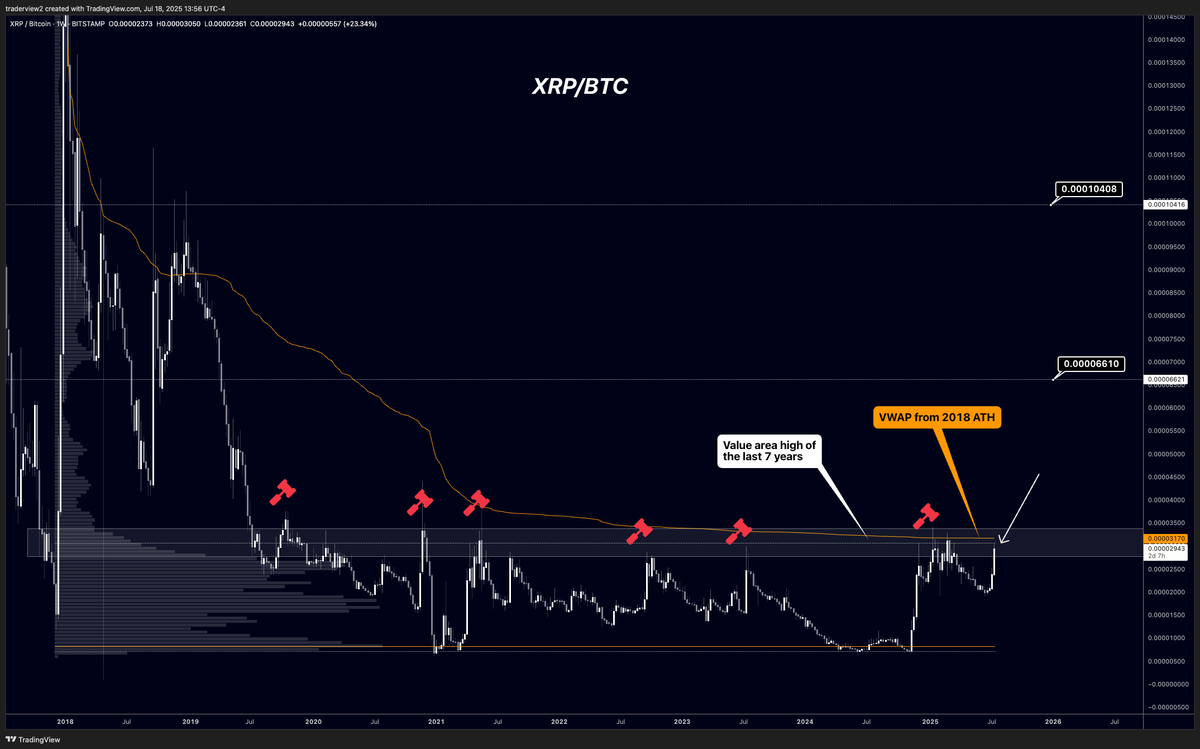
2nd chart - $XRPBTC:
This is another one we heavily tracked ~8 months ago when $XRP first was attempting to break it
Now here we are again, attempting to break the 2200+ day resistance that has rejected XRP over 8 times
Similar to the $XRP.D chart, anytime this has been reclaimed in the past, an explosive move occurred shortly after
I think that is implied, considering there have been 8+ rejections over the last 7 years...
Targets are shown once the level is cleared. I think this one is very important, so alerts are set on my end and will continue to update any advancements
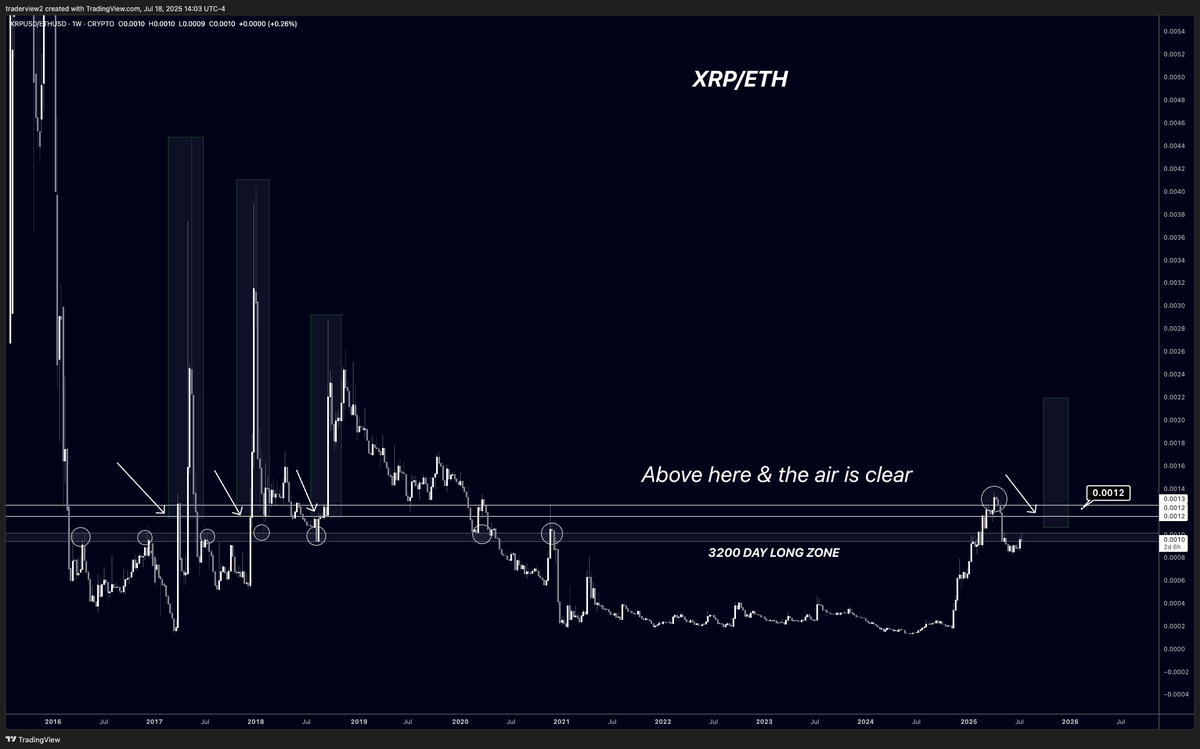
3rd chart - $XRPETH:
I was heavily updating this chart a few months ago right when we were attempting to break this 3200 day long zone, but XRP fell short and didn't see any follow through
Based on how $ETH has been performing, there is a chance this one is even more delayed than the previous two, but the idea stays firm
Anytime price has fully flipped the zone shown, we've only ever seen an explosive move
This is one I continue to watch, but lighter than the previous two
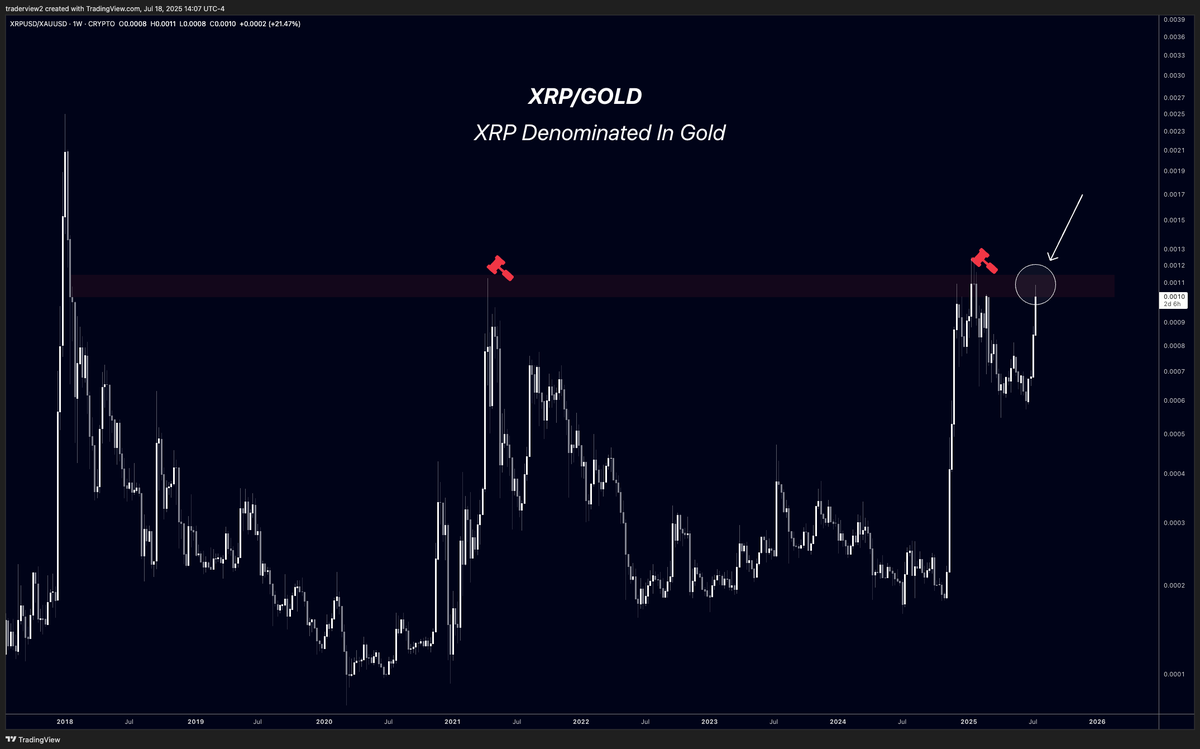
Last chart - $XRP / $XAU (Gold)
I really like this one, considering gold is a much harder asset to price anything against, compared to USD. It gives a truer value representation, effectively eliminating some of the inflation effect of USD pairs
As we can see, XRP is still under the zone that rejected it back in 2021
Removing inflation, $XRP technically has not yet hit an ATH in "value" terms. Think of all the money printing we have seen since 2018
So this chart will be on the top of my radar. Once we clear the current zone, I think it'll be aligned with the chance of a true price discovery pump, above $5.
Thanks for reading. I hope this paints an interesting picture of the checks needed IMO for a true bull trend into the high single digits.
I'll be watching and updating these in the weeks to come.
@Xrpdemon589 No, I was never in EW trader. I used it briefly in combination in 2018 / 2019
I won’t dare to guess wave counts 🤣
This post may upset some...
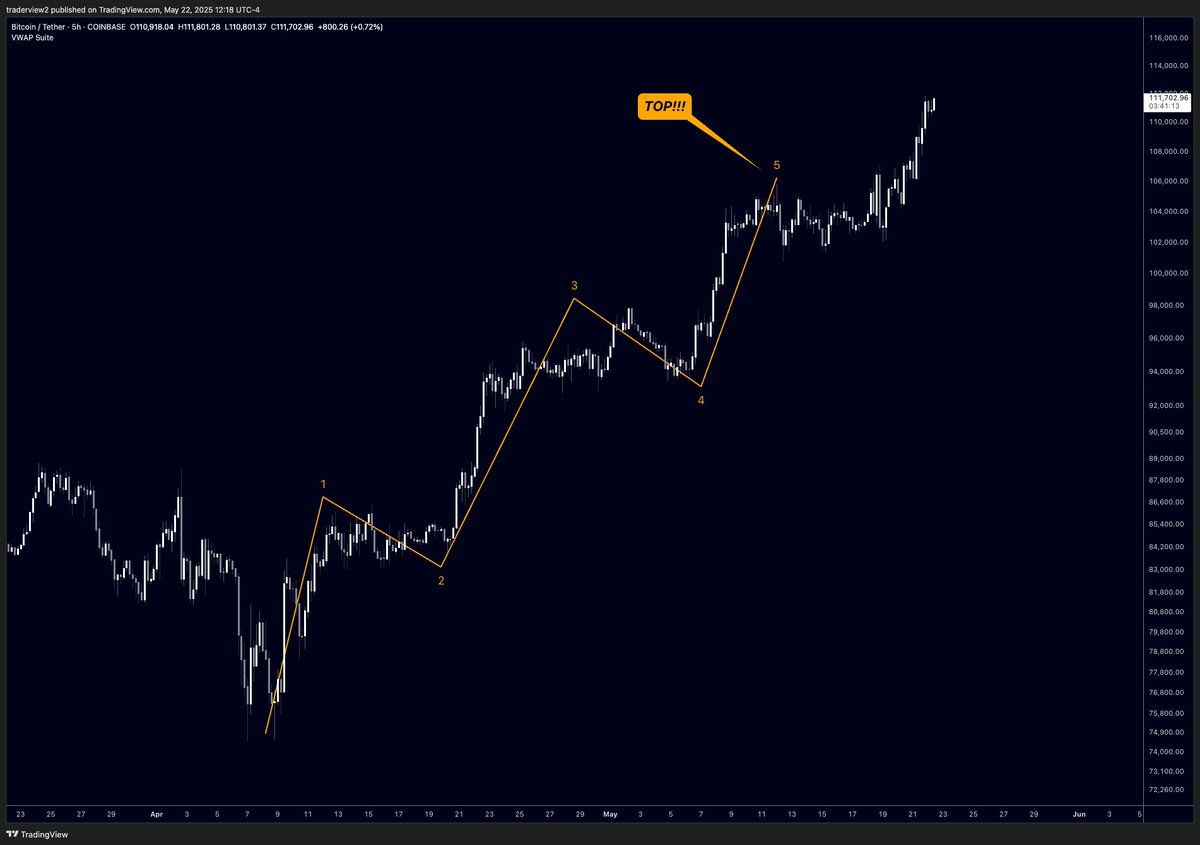
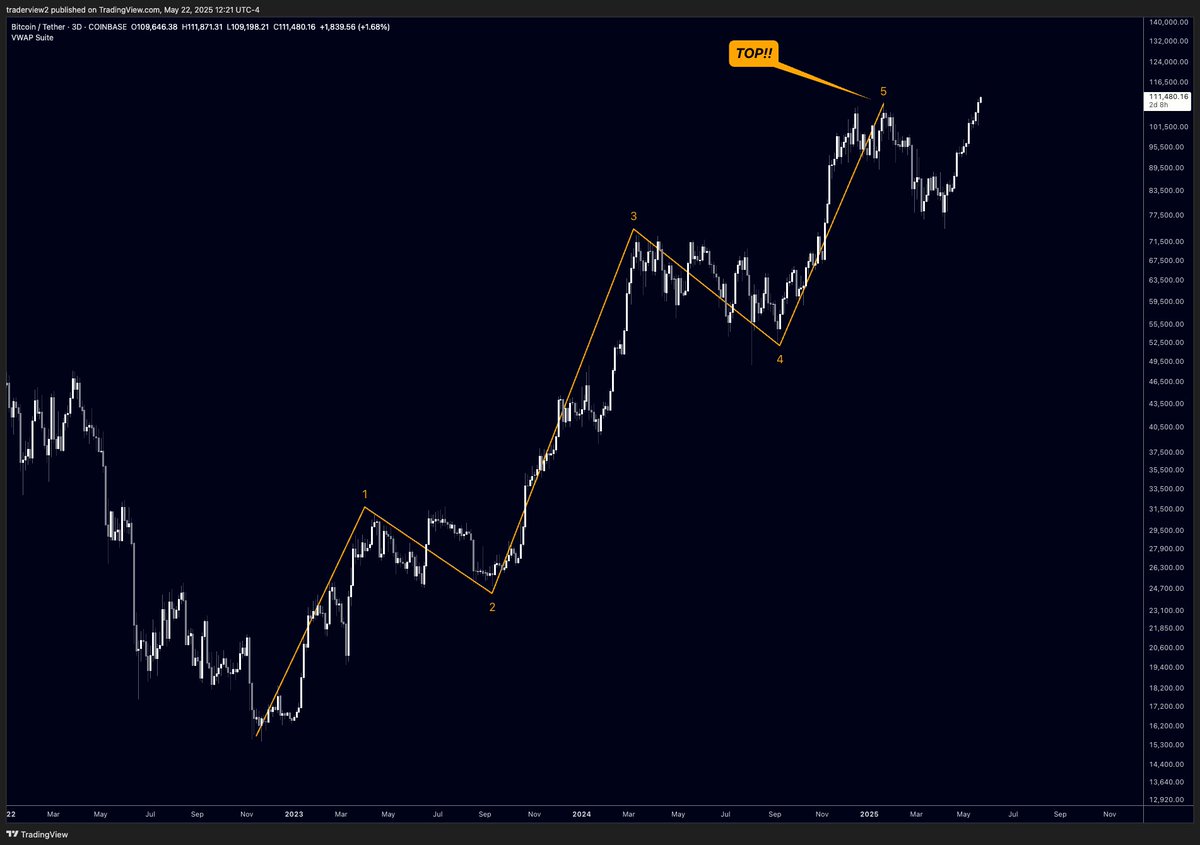
But below are two prime reasons I don’t use Elliott Wave Theory
After 8 years of testing nearly every form of technical analysis, I’ve found Elliott Wave to be the most subjective by far
You can always find a wave count that fits. Bullish or bearish, it’s endlessly moldable
That’s the problem - too much room for interpretation, not enough actionable edge
EW can look elegant in hindsight, but it's prone to bias
The fact that you can force fit wave counts to almost any price action makes it more of a storytelling tool than a predictive framework
My advice - drop the theory and focus on what actually moves the market
78.18K
836
The content on this page is provided by third parties. Unless otherwise stated, OKX is not the author of the cited article(s) and does not claim any copyright in the materials. The content is provided for informational purposes only and does not represent the views of OKX. It is not intended to be an endorsement of any kind and should not be considered investment advice or a solicitation to buy or sell digital assets. To the extent generative AI is utilized to provide summaries or other information, such AI generated content may be inaccurate or inconsistent. Please read the linked article for more details and information. OKX is not responsible for content hosted on third party sites. Digital asset holdings, including stablecoins and NFTs, involve a high degree of risk and can fluctuate greatly. You should carefully consider whether trading or holding digital assets is suitable for you in light of your financial condition.

