🗓️ Do you track quarterly returns for the tokens you watch?
Crypto markets move in cycles, and our returns dashboard helps you see the patterns.
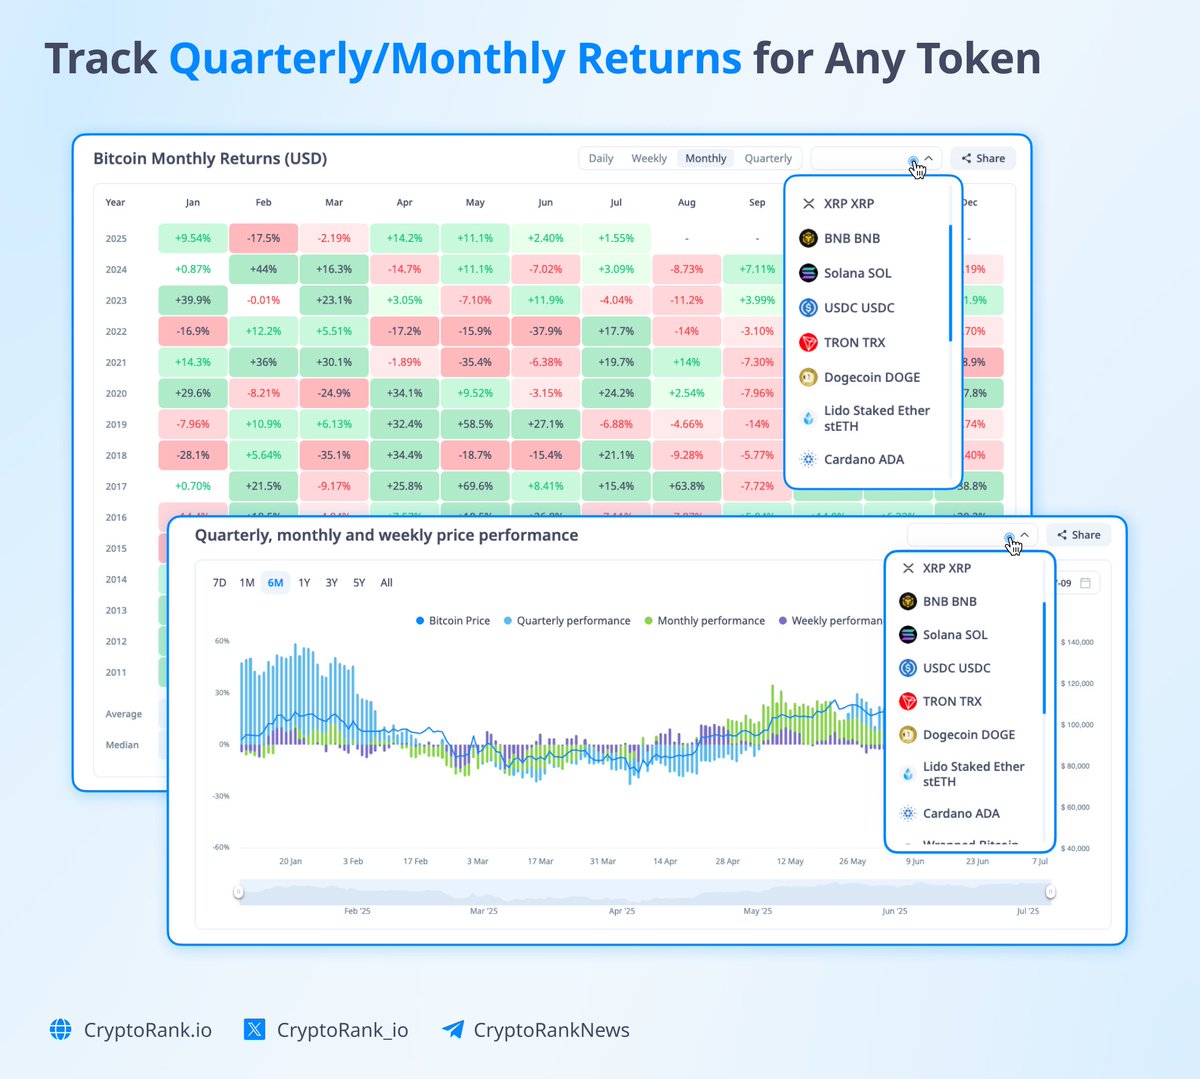
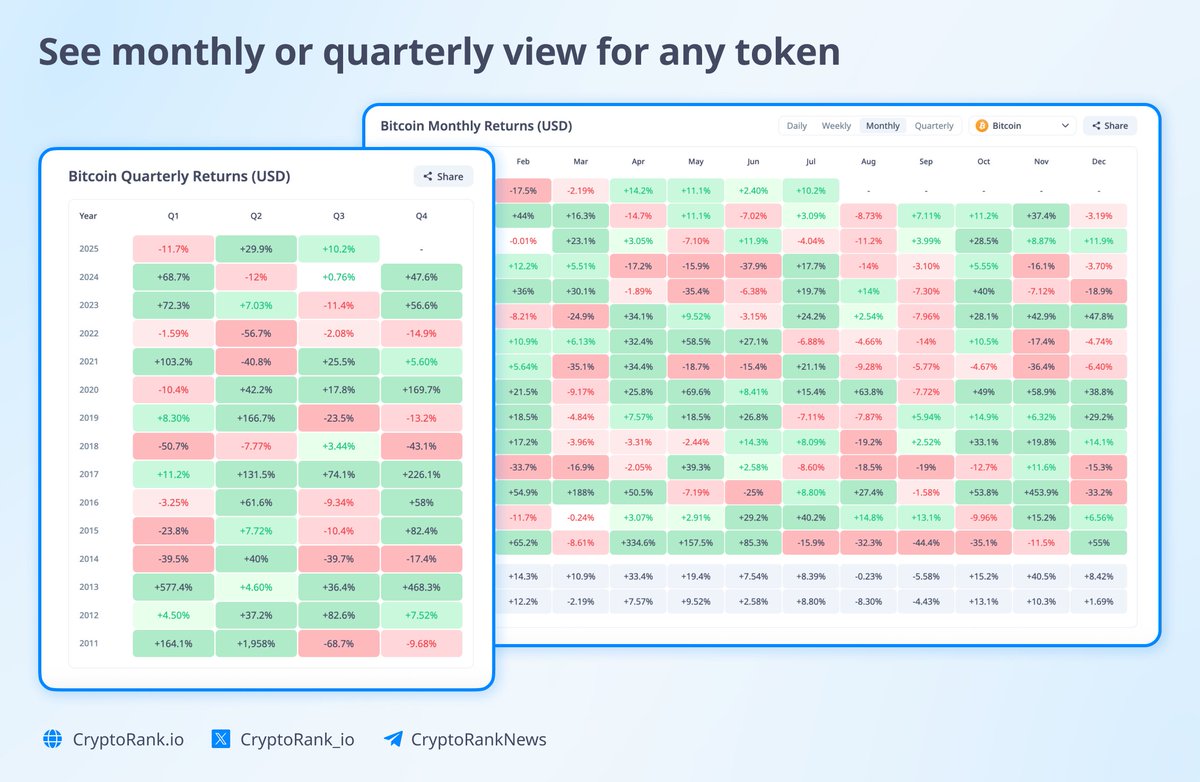
Get a clear, color-coded view of the quarterly/monthly performance for $BTC, $ETH, or any other token:
👉

It shows:
📊 How this quarter compares to past cycles so far
🔥 Whether July is usually a bullish month for $BTC (it is)
📉 And when markets tend to sell off
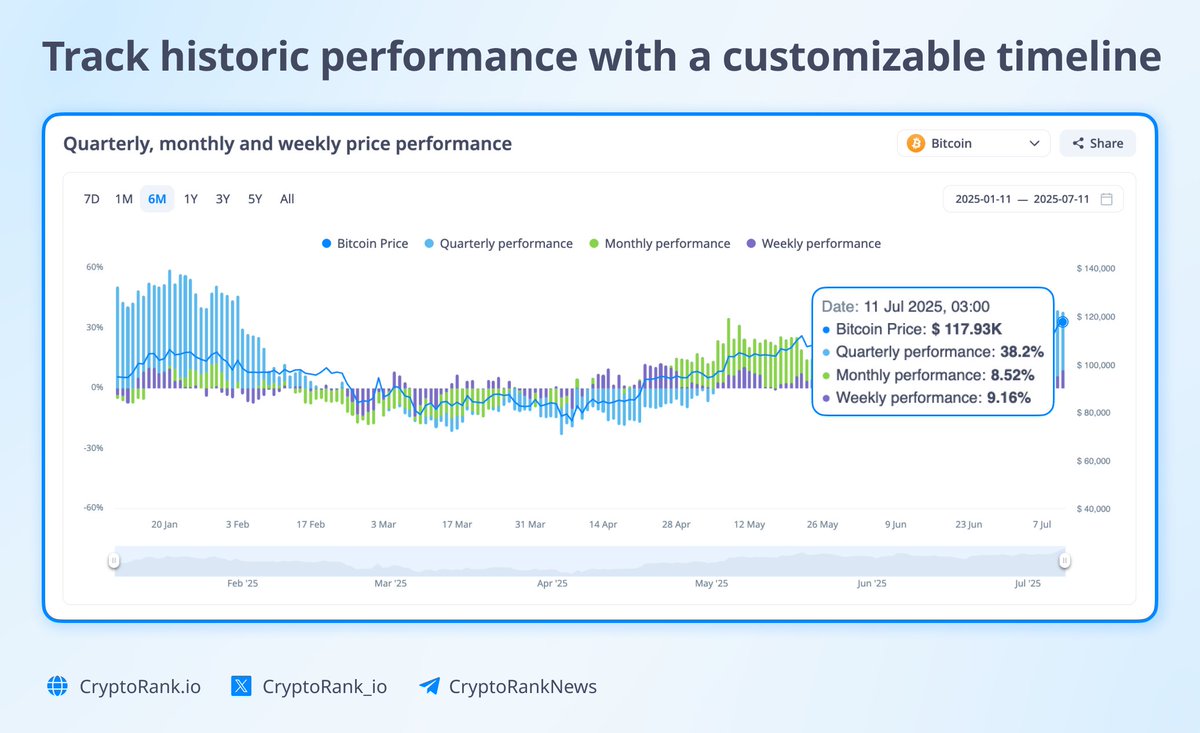
You’ll also get a detailed performance chart with flexibility to pick any custom date range for top-20 tokens.

And last but not least: it’s well-structured and instantly readable, making for perfect screenshots.
Explore the dashboard at:
Or open any token’s page → Analytics tab

36.7K
186
The content on this page is provided by third parties. Unless otherwise stated, OKX is not the author of the cited article(s) and does not claim any copyright in the materials. The content is provided for informational purposes only and does not represent the views of OKX. It is not intended to be an endorsement of any kind and should not be considered investment advice or a solicitation to buy or sell digital assets. To the extent generative AI is utilized to provide summaries or other information, such AI generated content may be inaccurate or inconsistent. Please read the linked article for more details and information. OKX is not responsible for content hosted on third party sites. Digital asset holdings, including stablecoins and NFTs, involve a high degree of risk and can fluctuate greatly. You should carefully consider whether trading or holding digital assets is suitable for you in light of your financial condition.

